By Patrick McLaughlin
In partnership with Fluke Networks and BICSI, in late 2020 we at Cabling Installation & Maintenance collected salary and wage information from cabling professionals employed in the information and communications technology (ICT) industry in the United States, for the third consecutive year. This updated compensation study reveals trends in total compensation across characteristics that include geographic regions, industry experience, working environments, technical expertise, education levels, and professional certifications. This article will summarize and detail some of the survey results.
Methodology
We collected data via an online survey. Invitations to participate in the survey were sent and data was collected during the month of December 2020. The survey reached professionals inside and outside the United States, but we collected information only from individuals working in the U.S. We obtained a total of 670 usable responses; those responses are the basis for the data in this article.
Among the questions we asked respondents was their primary job function. We also asked participants’ age and number of years they have been working in the industry. Other questions included education level (from less than a high school diploma to a graduate-level college degree) and membership in a labor union or guild. Additionally, we asked participants to self-identify their respective levels of expertise in the technology areas of outside plant, security, data center installations, the Internet of Things, fiber optics, industrial automation, and wireless systems including WiFi, DAS and small cells. We also asked them to identify, from a pick-list, which professional credentials they hold. And of course, we asked them to identify their compensation—including whether they are paid by annual salary or hourly wage, and how much if any compensation they received in the form of a bonus over the previous 12 months. We also asked questions about the extent to which the COVID-19 pandemic has affected their own working status, and the extent to which it has affected their employers’ staffing requirements.
Exploring the results
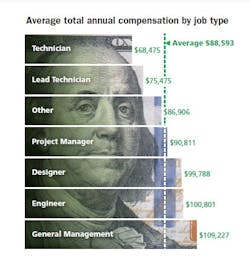
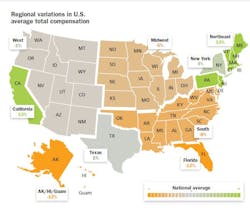
The 670 participants’ job types break down as follows: 68 designers, 137 engineers, 78 general managers, 108 lead technicians, 123 project managers, 83 technicians, and 73 in the category “other.” The average annual compensation for each job type is: designer, $118,685; engineer, $113,360; general management, $116,652; lead technician, $84,207; project manager, $96,136; technician, $70,777; other, $98,561.Because we collected information only from individuals employed in the U.S., we were able to compare the average salaries in different regions of the country. When we compiled this data, we allowed four states—California, Florida, New York, and Texas—to stand on their own because we had a sufficient number of participants from each of these states for the statistics from each to be valid. In California and New York, workers’ income outpaced the national average (California, +5 percent and New York, +3 percent), while in Texas (-4 percent) and Florida (-10 percent), income was below the national average.
The West (+3 percent), Northeast (+2 percent), and Mid-Atlantic (+2 percent) regions outpaced the national average while Alaska/Hawaii/Guam (-15 percent), the Midwest (-10 percent), Great Lakes (-8 percent), and South (-8 percent) regions trailed the overall national average.
Capitalizing on expertise
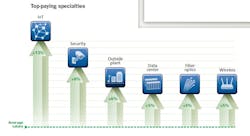
We asked survey respondents to identify their own levels of expertise with the following technology or infrastructure-system types: wireless (including WiFi, DAS and small cells), fiber optics, data center installations, security, the Internet of Things, industrial automation, and outside plant systems. Respondents had the following levels to choose from: none, some, medium, high, very high. When compiling data, we organized those who characterized themselves a shaving a high or very high level of expertise in each. In every case, workers who identified themselves as having a high or very high level of expertise earned more than those without such expertise. Below are the specific results, with the technology type followed by the total number of respondents who claim high or very high expertise levels, then the percentage by which these individuals’ compensation is higher than the average. Please note that these numbers incorporate job-type-for-job-type comparisons. In other words, the number is an overall reflection of how much workers of each job type (engineer, technician, general management, etc.) with such expertise earn compared to workers of the same job type who do not have as high a level of expertise.
- Wireless systems: 339 individuals, +6 percent compensation
- Fiber optics: 421 individuals, +7 percent
- Data center installations: 277 individuals, +10 percent
- Outside plant: 298 individuals, +6 percent
- Security: 221 individuals, +6 percent
- Industrial automation: 110 individuals, +6 percent
- Internet of Things: 155 individuals, +16 percent
Unions, certifications, and more
Concerning workers’ membership in a labor union or workers’ guild, we asked straightforwardly, “Are you a member of a labor union/workers’ guild?” Ninety-six respondents answered in the affirmative, and for all but one job type, union members’ income was higher than non-union members. Union-member designers showed the most modest salary difference, at 5 percent more than non-union designers. From there the numbers jump significantly, with union-member project managers at +24 percent, union-member technicians at +25 percent, union-member lead technicians at +27 percent, and union-member engineers at +28 percent. Only union-member general managers, at a staggering -39 percent, have a lower income than their non-union counterparts.
When we examined professionals’ compensation in the context of education level, we used the high school diploma or its equivalent as a baseline. From there we calculated the percentage above or below that baseline at which other education levels are compensated. The results follow.
- High school diploma or equivalent: 100 percent
- Associate’s degree: 87 percent
- Technical/Trade/Vocational school: 97 percent
- Bachelor’s degree: 105 percent
- Graduate degree: 107 percent
Among our aspirations for this study over the three years we have conducted it has been to collect and analyze information about compensation differences between the genders. Unfortunately, we continue to receive such a low number of responses from women that we are unable to offer statistically significant data. For the third consecutive year, approximately 4 percent of the responses to our survey came from women.
COVID-19 impact
Conducting the survey in late 2020, we had the opportunity to find out the extent to which the COVID-19 pandemic has affected respondents’ employment and, to an extent, their employers’ staffing situations.
For workers, 23 percent experienced reduced hours, furloughs, layoffs, and/or a reduction in contract work as a response to COVID-19-related business decline.
Sixty-one percent of companies implemented one or more of these actions—reduced hours, furloughs, layoffs, reduction in contractors—as a result of the downturn.
Despite the difficulties that COVID-19 and other factors brought to the ICT industry, 73 percent of survey respondents are optimistic or very optimistic about the future of their company. The list below shows the percentage of survey respondents employed by specific company types who are optimistic or very optimistic about the future.
- Distributor: 86 percent
- Architect/consultant/engineering: 80 percent
- Telco/MSO/service provider: 73 percent
- End-user organization: 72 percent
- Contractor/installer: 72 percent
When given the opportunity share what they would change about the industry in the future, several respondents focused on the next generation of professionals. “I would bestow industry knowledge and experience on our young workforce,” one said. “We have seen a large percentage of our seasoned workforce retire in the past several years, and the amount of new hires with no knowledge or experience is staggering.”
Another commented, “I would establish better or simpler programs and enhanced opportunities for professional mentoring with less-experienced staff.”
We at Cabling Installation & Maintenance and Fluke Networks plan to implement this compensation study again in the year ahead, producing results in early 2022.
Patrick McLaughlin is our chief editor.


