Passing with flying colors: Test equipment showcased
The 2020 Cabling Innovators Awards honored three test apparatus that enhance the in-the-field experience of installers, technicians, and network owners. In a year when we’ve all been put to the test, this collection of innovative technologies is particularly noteworthy. All three earned Gold Awards, meaning they demonstrated excellent innovation with clear benefits.
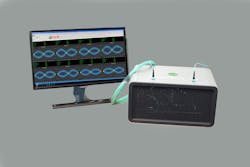
The WideOptix measurement system from AEM offers a purpose-built eye-diagram based bandwidth verification system for multimode fiber-optic cables and components. Standards organizations such as TIA and ISO require certification testing of fiber-optic cables after installation. While the certification testing is necessary, its effect is limited to identifying light-blocking events along the fiber run. It does not confirm whether the fiber is good enough for the intended speed. WideOptix test system is designed to detect bandwidth limitations before deploying actual data services. With its fast testing and detailed and clear reporting, with pass/fail indication, WideOptix is an easy-to-operate test system. WideOptix-SR4 measurement system can be viewed as a sophisticated and purpose-built combination of a signal generator and an oscilloscope for extremely high-speed signals ranging in 25-GHz frequencies.
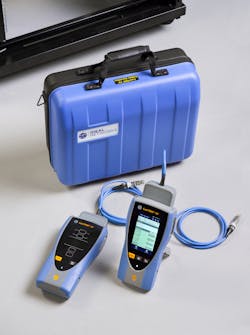
LanTEK IV is a copper and fiber cable certifier that provides a unique way to certify, bringing a new standard to the industry and enabling 7-second Category 6A test times. LanTEK IV includes the patent-pending VisiLINQ permanent link adapter, which Ideal Networks describes as “a unique way to test that gives users everything needed to initiate testing and view the results in the palm of their hand. This innovation helps technicians to work smarter, saving time and increasing productivity. The RJ45 tip on the VisiLINQ Permanent Link Modules are also field-replaceable to reduce cost of ownership.” LanTEK IV includes a Live Wiremap feature, which allows installers to instantly see a fault before the autotest even begins, so no time is wasted waiting for the test to complete. Time-domain reflectometry enables LanTEK IV to show an accurate distance to fault. The test platform incorporates the IDEAL AnyWARE cloud test management system, which allows real-time collaboration between project managers and technicians.
LiveLight is the newest feature of Softing’s NetXpert XG. It is a trend plot of the dB loss across a fiber from tester to tester. “That’s dB loss from an SFP at one end of the fiber to the SFP on the other end of the cable,” Softing explains. “You will see the dB loss vs. time on a trend plot on the NetXpert XG in real time. As conditions change, such as effects due to moving a bad connector, you will see loss levels change on a real-time trend chart display.” When describing the common real-world scenarios that gave rise to LiveLight’s development, Softing says, “What if you are testing fiber, and you get an unacceptable loss measurement? Then you retake the measurement, and this time, magically, the reading is good. This is frustrating. Is it the test cables? Did I do something wrong? Could it be an intermittent problem? What if I need to test cables that move as machines move?” Instead of taking a single snapshot, LiveLight offers a continuous light-loss measurement and enables users to view the results continuously on a live streaming plot.


